 ACSM AMERICAN FITNESS INDEX® HEALTH AND COMMUNITY FITNESS STATUS OF THE 50 LARGEST METROPOLITAN AREAS 2016 Edition. The American College of Sports Medicine (ACSM) and its partner/supporter Anthem Foundation developed the 2016 American Fitness Index® (AFI) report that ranks the 50 largest metropolitan statistical areas (MSAs) in the US, which includes the nation’s biggest cities. What follows in this post is my attempt to summarize how the rankings were determined, how the reports for each area are constructed, and then the ranking list. You should read the actual report for the specific city/MSA that’s of interest to you; there’s too much information to easily summarize beyond the obvious fact of position in the ranking.
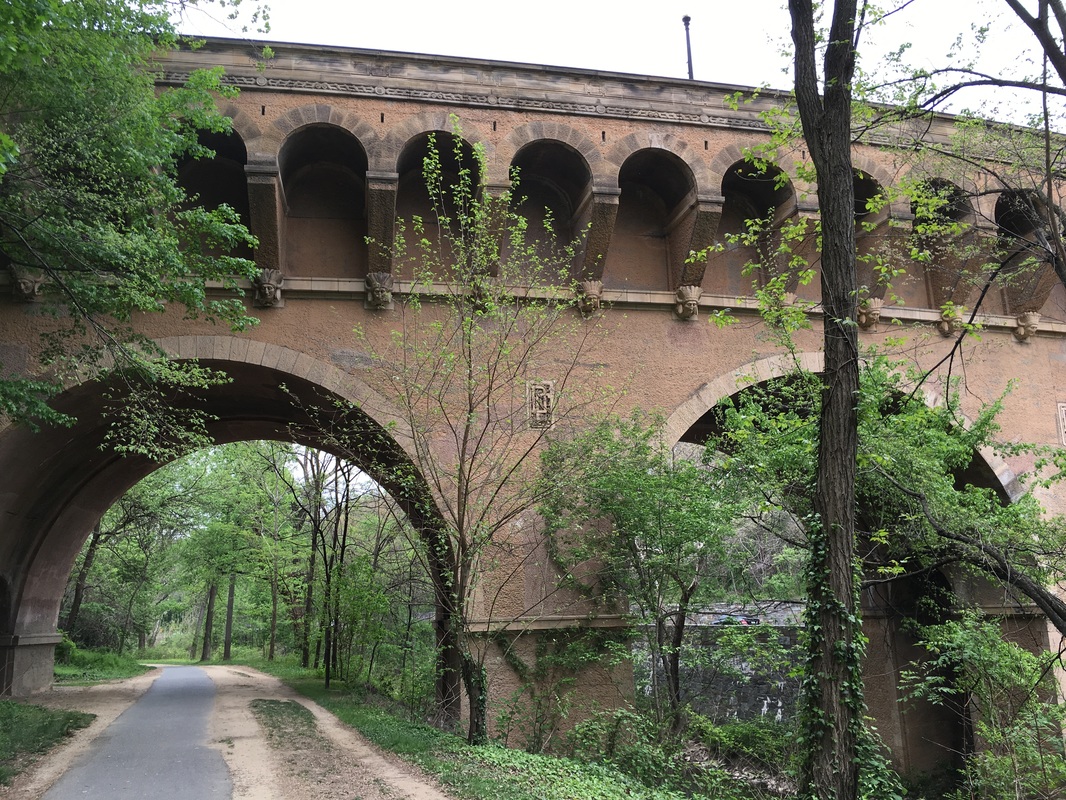
My general thoughts after sifting through the information, based on the indicators: The cities or MSAs with the highest rankings are.... - not necessarily considered as having the “best” weather - may not have the most young healthy people - provide the most public or private parks, recreational facilities, green spaces for fun - provide the most accessible means of public transportation, walking, or biking to work and/or play - require physical education in schools - have the least number of people suffering with diseases that might be avoided/helped with exercise Making physical activity, whether for necessity or pleasure, convenient and enjoyable for persons of all ages, goes a long way in helping persons living in large metropolitan areas to become or remain fit and healthy. It is understandable that our nation's capitol has held the number one spot on the list. All tax-paying US citizens have surely "invested" in the public areas and transportation in that lovely city. When visiting i very much enjoy running the Mall and seeing the monuments or through Rock Creek Park (picture above is from this spring, it's a repeat). We might consider strongly encouraging our local and state governments to work toward creating a similar environment nearer to home, thereby allowing us to enjoy what we helped make available in Washington DC! RUN HAPPY! ************************************************************************************************* See the ranking and read more about the report here (below), or view the actual report and your city’s data at: http://americanfitnessindex.org/wp-content/uploads/2014/02/acsm_afireport_2016_FINAL.pdf The report: This is the groups’ 9th edition. The AFI report executive summary indicates that it is “a reliable measure of community fitness for the country’s 50 largest metropolitan statistical areas (MSAs)” and a “one-of-a-kind, evidence-based analysis” of the strengths and challenges” of each. The summary also says the AFI report identifies “opportunities for improvement” in each MSA. It quotes a Washington Post story, “most lists of ‘America’s fittest cities’ are ridiculous, but the American College of Sports Medicine puts out a legit one each year that actually tells us something about people’s health habits and the opportunities their communities provide to stay fit.” The general reason for place in rankings is explained: “Cities that ranked near the top of the index have more strengths and resources that support healthy living and fewer challenges that hinder it. The opposite is true for cities near the bottom of the index.” In looking at the 50 MSA list we are cautioned to consider not only the rank but the actual score, as some MSAs are separated by less that one full point, and there may be relatively little difference among some ranked cities (St. Louis MO is #28 and Los Angeles is #29 on the ranking but their scores are separated by 0.1 point). Also, high or low ranking does not necessarily mean that the city has excellent or poor values across all indicators. The 32 indicators for the data index were selected by the following criteria (each must be): Related to the level of health status and/or physical activity environment for the MSA Measured recently/routinely, reported by a reputable agency/organization, and provided in a timely fashion Available to the public Modifiable through community effort (example: smoking rate is included, climate is not) Sources include: Centers for Disease Control and Prevention (behavioral risk factors and school health), Trust for Public Land (community/environmental indicators), U.S. Census/American Community Survey, U.S. Department of Agriculture, Federal Bureau of Investigation’s (FBI). Building the data index: elements were initially scored and weighted in 2008 for inclusion, then reviewed and updated in 2015. That year a new environmental/community measure, “percent within a 10-minute walk to a park” was added. Because some changes were made in the data elements of the index in 2015, comparisons can be only be made between the earlier years and 2015 and 2016 reports with individual elements that did not change in 2015. “The overall score and the sub-scores for 2015 and 2016 are NOT comparable to earlier years.” Limitations of the AFI Data Report: Behavioral (personal health) indicators were based on self-reported data but the inherent biases should be similar across all areas and the relative differences be valid. In 2011 methodology changes and addition of cell phone sampling means data before and after 2011 are not totally comparable. FBI violent crimes data may not be comparable because of differences in law enforcement policies/ practices between MSAs. The Trust for Public Land community/environmental indicators include only resources data for cities, not for the entire MSA, and not all cities had data, which required an adjustment for the ranking calculation. Individual MSA reports: for each MSA in the AFI, listed alphabetically, a posted report shows: Total score and Ranking Summary of findings based on the indicator scores: - Areas of excellence (MSA is at or better than target goal for the indicator) - Improvement priority areas (MSA is worse than 20% below target goal for the indicator) - Description of the MSA (demographics) Indicator scores (bar graphs compare MSA with “target goal” determined in 2008-2012 or 2014) - Personal Health (number of indicators): Health behaviors (6) Chronic health problems (9) - Community/Environmental (number of indicators): Built environment (7) Recreational facilities (8) Policy for school physical education (1) Park-related expenditures (1) Rankings Washington-Arlington-Alexandria, DC-VA-MD-WV 77.9 Minneapolis-St. Paul-Bloomington, MN-WI 76.7 Denver-Aurora-Lakewood, CO 72.6 Portland-Vancouver-Hillsboro, OR-WA 69.6 San Francisco-Oakland-Hayward, CA 69.3 Seattle-Tacoma-Bellevue, WA 69.0 Boston-Cambridge-Newton, MA-NH 67.0 Salt Lake City, UT 65.5 Hartford-West Hartford-East Hartford, CT 65.3 San Diego-Carlsbad, CA 64.1 San Jose-Sunnyvale-Santa Clara, CA 63.4 Chicago-Naperville-Elgin, IL-IN-WI 63.1 Sacramento-Roseville-Arden-Arcade, CA 62.4 Atlanta-Sandy Springs-Roswell, GA 62.3 Austin-Round Rock, TX 59.3 Raleigh, NC 59.3 Baltimore-Columbia-Towson, MD 56.5 Richmond, VA 55.1 Virginia Beach-Norfolk-Newport News, VA-NC 54.6 Milwaukee-Waukesha-West Allis, WI 54.2** Providence-Warwick, RI-MA 54.2** New York-Newark-Jersey City, NY-NJ-PA 53.8 Cincinnati, OH-KY-IN 52.7 Philadelphia-Camden-Wilmington, PA-NJ-DE-MD 52.3 Cleveland-Elyria, OH 52.1 Tampa-St. Petersburg-Clearwater, FL 51.7 Pittsburgh, PA 51.3 Saint Louis, MO-IL 50.9 Los Angeles-Long Beach-Anaheim, CA 50.8 Kansas City, MO-KS 50.3 Jacksonville, FL 49.5 Miami-Fort Lauderdale-West Palm Beach, FL 48.2 New Orleans-Metairie, LA 46.0 Phoenix-Mesa-Scottsdale, AZ 44.9 Buffalo-Cheektowaga-Niagara Falls, NY 43.6 Riverside-San Bernardino-Ontario, CA 42.7 Dallas-Fort Worth-Arlington, TX 42.2 Columbus, OH 41.6 Charlotte-Concord-Gastonia, NC-SC 41.4 Houston-The Woodlands-Sugar Land, TX 40.6 Las Vegas-Henderson-Paradise, NV 40.4** Detroit-Warren-Dearborn, MI 40.4** Orlando-Kissimmee-Sanford, FL 40.3 Birmingham-Hoover, AL 39.4 San Antonio-New Braunfels, TX 35.0 Nashville-Davidson-Murfreesboro-Franklin, TN 34.2 Memphis, TN-MS-AR 33.3 Louisville/Jefferson County, KY-IN 31.8 Oklahoma City, OK 29.5 Indianapolis-Carmel-Anderson, IN 26.6
0 Comments
Your comment will be posted after it is approved.
Leave a Reply. |
BRIDGE TO PHYSICAL SELF
Running, walking, and fitness activities enable us to experience our physical selves in a world mostly accessed through use of fingers on a mobile device. 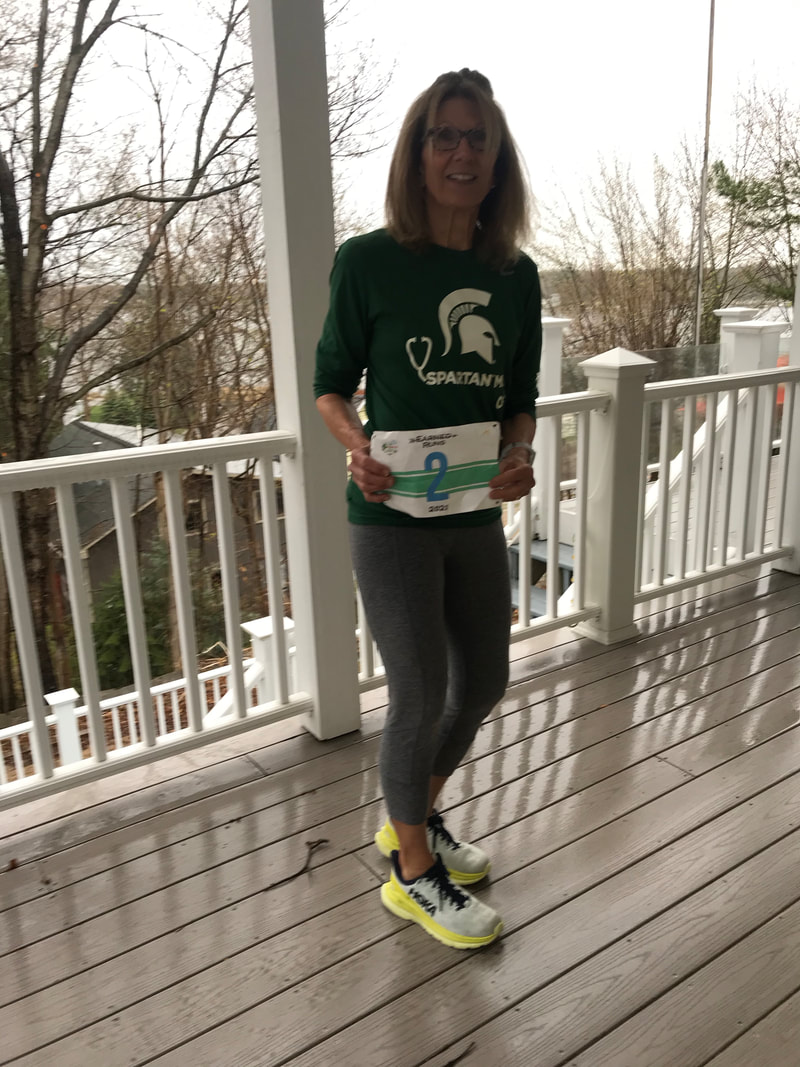
Finished my first 50K challenge, a virtual but real effort April 6, 2021. Qualifies me as an ultra-marathoner! All rights reserved.
AuthorEARNED RUNS is edited and authored by me, runner and founder. In 1978 I began participating in 10K road races before 5Ks were common. I've been a dietitian, practiced and taught clinical pathology, and been involved with research that utilized pathology. I am fascinated with understanding the origins of disease as well as health and longevity. Archives
November 2023
CategoriesNew! Search Box
Earned Runs is now searchable! Check it out...
|
 RSS Feed